R Animations✨
- Ehsan Moghadam

- Nov 21, 2021
- 2 min read
Updated: Nov 23, 2023
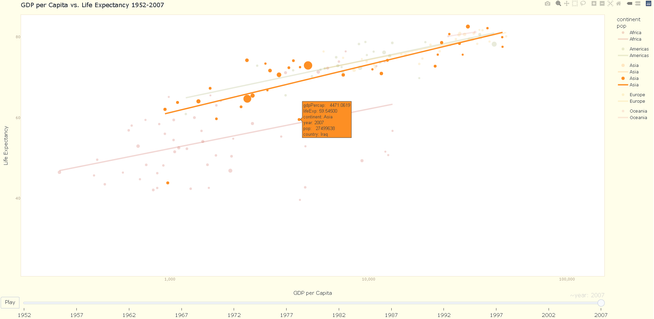
Most data visualizations are static, and while one can visualize a fair number of variables, however it can still be limited. Since we are in 2023, we can take advantage of our access to computer graphics and reveal more about the data by adding motion. To achieve this I used the Plotly package to add a frame aesthetic to the well-known Gapminder dataset. It contains historical (1952-2007) data on various indicators, such as life expectancy and GDP, for countries worldwide. Sidenote, I used the ggpomological package to theme my plot because I enjoy autumn color pallets!

#key packages used include:
library(gapminder)
library(plotly)
library(ggplot2)
library(ggpomological)
# Creates ggplot, adds a frame aesthetic, and allows interactive linked views of a series of frames over time.
g <- crosstalk::SharedData$new(gapminder, ~continent)
gg <- ggplot(g, aes(gdpPercap, lifeExp, color = continent, frame = year)) +
  geom_point(aes(size = pop, ids = country)) +
  ggtitle("GDP per Capita vs. Life Expectancy 1952-2007") +
  ylab("Life Expectancy") +
  xlab("GDP per Capita") +
  theme_pomological() + scale_color_pomological() +
  geom_smooth(se = FALSE, method = "lm") +
  scale_x_log10(labels=scales::comma)
ggplotly(gg) %>%
  highlight("plotly_hover")

This ggplot2 animation using plotly is interactive, in that you can hover the mouse over a point and see a pop-up window giving details about the country. Simply printing the plot object will render the chart locally in your web browser or in the RStudio viewer. Click on legend entries to hide/show traces, click-and-drag on the chart to zoom, double-click to autoscale, shift-and-drag to pan.


Resources:
Aden-Buie, G. (n.d.). ggpomological: Pomological plot themes for ggplot2. Retrieved, from https://www.garrickadenbuie.com/project/ggpomological/
Gapminder. (n.d.). gapminder: Data from Gapminder. CRAN. Retrieved, from https://cran.r-project.org/web/packages/gapminder/readme/README.html
Plotly. (n.d.). Getting started with Plotly for R. Retrieved, from https://plotly.com/r/getting-started/
The R Graph Gallery. (n.d.). Animation. Retrieved from https://r-graph-gallery.com/animation.html